D2C Marketing Statistics for 2026
Sourced D2C marketing statistics for 2026 across acquisition, conversion, email, social, creative, and AI. Compare each figure with your own store data.
On this page
These D2C marketing statistics cover acquisition, conversion, retention, social media, creative, and AI in 2026, and each one links to its source. Use the category that matches your current decision, then compare the statistic with your own margin, audience, and measurement window.
A benchmark is a starting point for a test. The short explanation under each number tells you what to check before changing a budget or workflow. Practical guidance without a reliable published figure behind it is collected at the end, under what to do with these numbers.
Customer Acquisition
Start with the cost of a new customer, then examine which creative and channel decisions can change it.
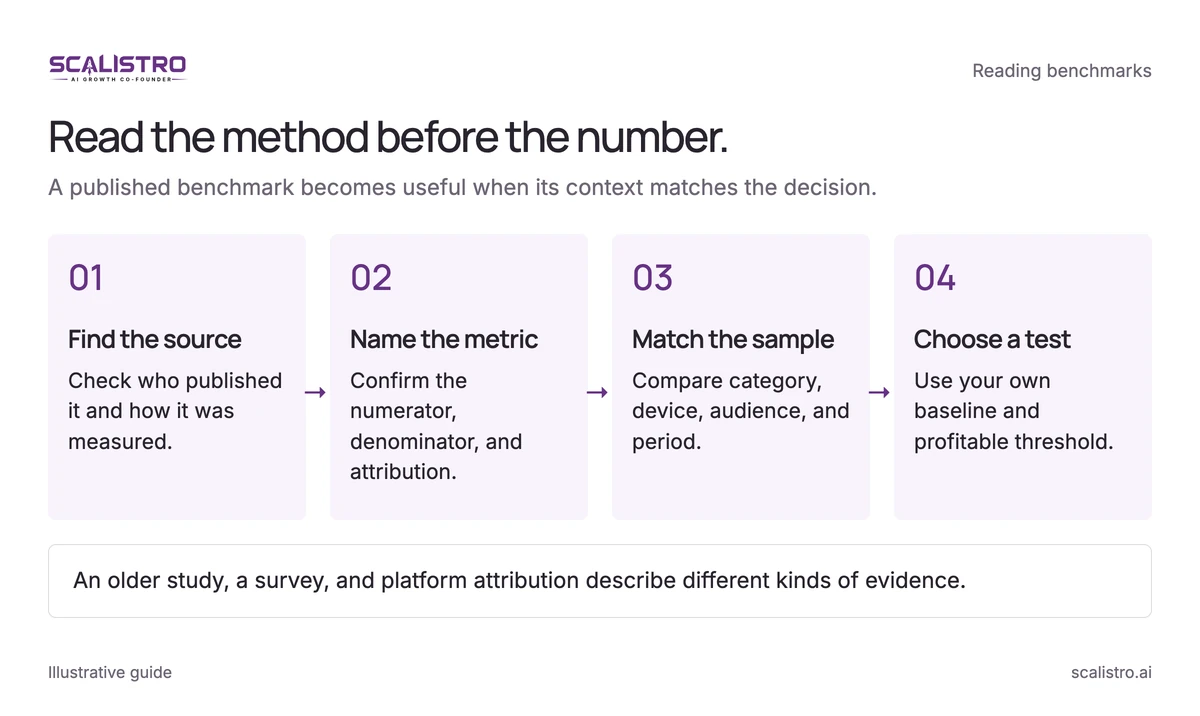
Swipe to explore. Tap to open full size.
Image details: Read the method before the number.
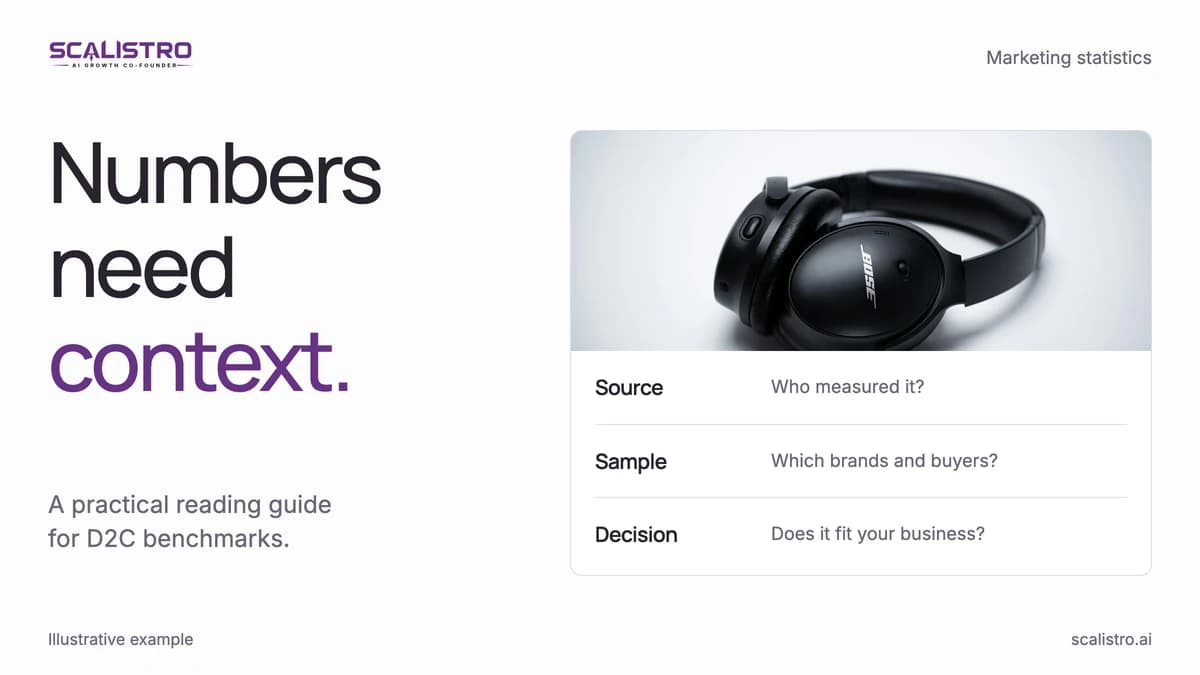
Read the method before the number. A published benchmark becomes useful when its context matches the decision. Find the source - Check who published it and how it was measured.; Name the metric - Confirm the numerator, denominator, and attribution.; Match the sample - Compare category, device, audience, and period.; Choose a test - Use your own baseline and profitable threshold. An older study, a survey, and platform attribution describe different kinds of evidence.
D2C customer acquisition cost has risen sharply over the past decade
SimplicityDX estimated that merchants lost an average of $29 on each new customer in 2022, up from $9 in 2013, a 222 percent rise in eight years (SimplicityDX, 2022). That figure measures the loss on a new customer's first order, not total acquisition cost, so treat it as a direction rather than a benchmark. Compare your own new-customer cost with contribution margin and payback before responding to a higher platform CPM.
Creative is the biggest lever in advertising, accounting for 47% of sales contribution
In Nielsen's 2017 analysis of 500 campaigns across TV, digital, print, and radio, creative accounted for 47 percent of a campaign's contribution to sales, well ahead of targeting (Recast, citing Nielsen 2017). Before changing a weak ad's audience, test a clearer product benefit, stronger opening, or more credible proof.
Referred customers are worth at least 16% more than other customers
A study of about 10,000 customers at a German bank found referred customers were at least 16 percent more valuable than comparable non-referred customers, with higher margins and better retention (Schmitt, Skiera and Van den Bulte, Journal of Marketing, 2011). The study is older and outside ecommerce, so test the idea in your own store: offer a $10 to $20 credit for each side with a simple tracking flow, then compare referred buyers' margin and repeat rate with paid-acquisition cohorts.
Conversion & Revenue
The overall store rate hides large differences by device, channel, and order value. Diagnose those parts separately.
The median Shopify store converts about 1.4% of sessions
Littledata's benchmark of 421 Shopify stores puts the median conversion rate at 1.4 percent of sessions, with the top 20 percent of stores above 2.6 percent and the top 10 percent above 3.4 percent (Littledata, 2026). Rates differ widely by traffic source, device, price point, and category, so compare like traffic and devices before redesigning a page.
Accelerated checkout such as Shop Pay lifts conversion
Accelerated checkout removes typing and account-creation steps on a phone. Shopify reports that Shop Pay lifts conversion by up to 50 percent compared with guest checkout (Shopify, 2023). Test the full phone purchase path before adding more checkout features.
Abandoned cart emails earn the most revenue per recipient of any automated flow
In Klaviyo's 2026 benchmark, abandoned cart emails averaged $6.77 in revenue per recipient, the highest of any automated email flow, and the top 10 percent of brands reached $13.70 (Klaviyo, 2026). Try a short series at roughly 1, 24, and 72 hours, excluding anyone who purchased. Showing the cart contents, a clear call to action, and product proof usually works better than a generic reminder.
Showing reviews raises purchase likelihood, most of all for higher-priced products
Northwestern's Spiegel Research Center found that a product with five reviews was 270 percent more likely to be purchased than one with none, and that displaying reviews raised conversion 190 percent for a lower-priced product and 380 percent for a higher-priced one (Spiegel Research Center, 2017). Ask buyers after delivery, show authentic reviews near the product decision, and do not hide negative feedback that reveals a fixable issue.
Sites loading in 1 second convert 2.5x better than sites loading in 5 seconds
Portent's analysis of 20 sites found that an ecommerce site loading in 1 second had a conversion rate 2.5 times higher than one loading in 5 seconds (Portent, 2022). A Deloitte study commissioned by Google found that a 0.1 second improvement in mobile site speed raised retail conversion by 8.4 percent (Deloitte and Google, via web.dev). Compress oversized images, use a CDN, and audit apps that load scripts on every page before redesigning the page.
Email & SMS
Compare owned-channel return with the cost of building and keeping the list, then improve flows before increasing send volume.
Most companies report $10 or more back for every $1 spent on email
In Litmus's 2025 State of Email survey, 35 percent of companies reported $10 to $36 back for every $1 spent on email, 30 percent reported $36 to $50, and 5 percent reported more than $50 (Litmus, 2025). Those returns usually leave out list-building and creative costs, so review revenue per recipient and contribution margin before setting an email budget.
Automated email flows earn about 18x more revenue per recipient than campaigns
Klaviyo's 2026 benchmarks show flows produce nearly 41 percent of email revenue from just 5.3 percent of sends, with revenue per recipient nearly 18 times higher than campaigns (Klaviyo, 2026). The difference comes from timing: a flow follows a relevant action. Build welcome, cart, browse, post-purchase, and win-back flows before adding more broadcast sends.
SMS works best for a few relevant, time-sensitive messages
Text messages are read quickly, which makes SMS suited to restocks, shipping updates, and short launches. In Klaviyo's 2026 benchmark, abandoned cart texts averaged $4.48 in revenue per recipient (Klaviyo, 2026). Keep marketing texts to a few a month and watch opt-outs as frequency rises. SMS lists are usually smaller than email lists, so total SMS revenue is often lower.
Email deliverability problems quietly cost revenue
Validity found the global average inbox placement rate was 87.2 percent in 2025, so roughly one in eight marketing emails did not reach the inbox (Validity, 2026). As an illustration, on a 100,000-contact list with three weekly sends, raising placement from 85 to 95 percent adds 30,000 inboxed messages per week; at an assumed $0.08 revenue per delivered email, that is $2,400 weekly. Authenticate SPF, DKIM, and DMARC, monitor complaints, and prune inactive contacts with care. Avoid using opens alone because privacy protections can distort them.
Social Media
Use reach and engagement to decide what to produce, then check whether those interactions lead to qualified visits and buyers.
Instagram posts reach about 3 to 5 percent of followers on average, and reach fell 14% year over year
Socialinsider measured an average Instagram reach rate of 3.2 percent of followers per post, down 14 percent year over year, with carousels at 4.5 percent, Reels at 4.1 percent, and images at 4.0 percent (Socialinsider, 2026). Smaller accounts reach a larger share of their followers. Test the format mix that fits the product, then compare site visits as well as reach.
TikTok engagement averages about 2.6%, roughly five times Instagram's average
Socialinsider's 2026 benchmarks put the average TikTok engagement rate at 2.60 percent, compared with 0.48 percent on Instagram and 0.15 percent on Facebook (Socialinsider, 2026). Distribution can extend beyond follower count, so creator-style demonstrations and founder stories are worth testing against polished brand edits. Measure purchases before declaring a viral clip successful.
Shoppers trust recommendations from people they know more than any form of advertising
In Nielsen's global survey, 92 percent of consumers said they trust recommendations from people they know, ahead of every form of paid advertising (Nielsen, 2012). The survey is older, but customer photos, reviews, and unboxings still bring that kind of proof onto your pages. Request authentic submissions after purchase and secure permission before using them in ads or on product pages.
US social commerce sales are expected to pass $87 billion in 2025
Emarketer expects US social commerce sales to surpass $87 billion in 2025, with TikTok Shop making up nearly 20 percent of the market (Retail Dive, citing Emarketer, 2025). Checkout inside a social app can convert differently from your store, so test channel eligibility, fees, and fulfillment before adding another shop.
73% of social users say they will buy from a competitor if a brand does not respond
According to the 2025 Sprout Social Index, about three quarters of consumers expect a response within 24 hours or sooner, and 73 percent of social users say they will buy from a competitor if a brand does not respond on social (Sprout Social, 2025). Reserve time daily for useful replies, support handoffs, and customer content rather than using AI-generated responses as a substitute for listening.
Ad Creative
Creative benchmarks are useful when each variant has enough delivery and the result is tied to customer acquisition, not attention alone.
Up to 47% of a video campaign's value is delivered in the first three seconds
Facebook and Nielsen research found that up to 47 percent of the value in a video campaign was delivered in the first three seconds, and up to 74 percent in the first ten (Meta for Business). The research is older, but the lesson holds: compare visual movement, a direct question, and a clear product moment against the same video body. Track hook rate, measured as three-second views divided by impressions, against your own account's history.
Meta reports carousel ads can deliver 30-50% lower cost per conversion than single-image ads
Meta reports that advertisers have seen carousel link ads drive 30 to 50 percent lower cost per conversion than single-image link ads (Meta for Business). The figure comes from Meta's early results with the format, so test 5 to 7 cards that move from hook to benefit, proof, and CTA, and judge the purchase result in your own account.
AI in Marketing
AI can increase production and speed analysis. Compare approved output, customer results, and human review time rather than counting generations.
66% of marketers worldwide now use AI in their role
HubSpot's 2025 AI Trends for Marketers report found that 66 percent of marketers globally use AI in their roles (HubSpot, 2025). The figure covers marketers in general, not only D2C brands. Pick a workflow with a clear bottleneck before adding another tool simply to match adoption rates.
Highly segmented email lists earned more than 3x the revenue per recipient of unsegmented lists
Klaviyo found that highly segmented lists returned more than three times the revenue per recipient of unsegmented lists, $0.19 versus $0.06, in Q4 2017 holiday sends (Klaviyo). The data is older, but it shows why relevance matters more than volume. AI-assisted timing, subject lines, and product recommendations build on the same idea: use permissioned purchase and browsing data, and measure any lift against a holdout.
35% of marketers say too many AI tools do the same thing without connecting
In HubSpot's 2025 AI Trends for Marketers report, 35 percent of marketers said there are too many AI tools that all do the same thing but don't connect, and 42 percent cited data privacy concerns as a barrier (HubSpot, 2025). A separate tool for every format adds billing, handoffs, and inconsistent briefs. Consolidate where a shared workflow genuinely saves time; Scalistro brings creative production, social planning, and connected ad analysis together.
What to Do With These Numbers
These practices are widely used, but no reliable published figure measures them across D2C brands. Treat each one as a test to run in your own account.
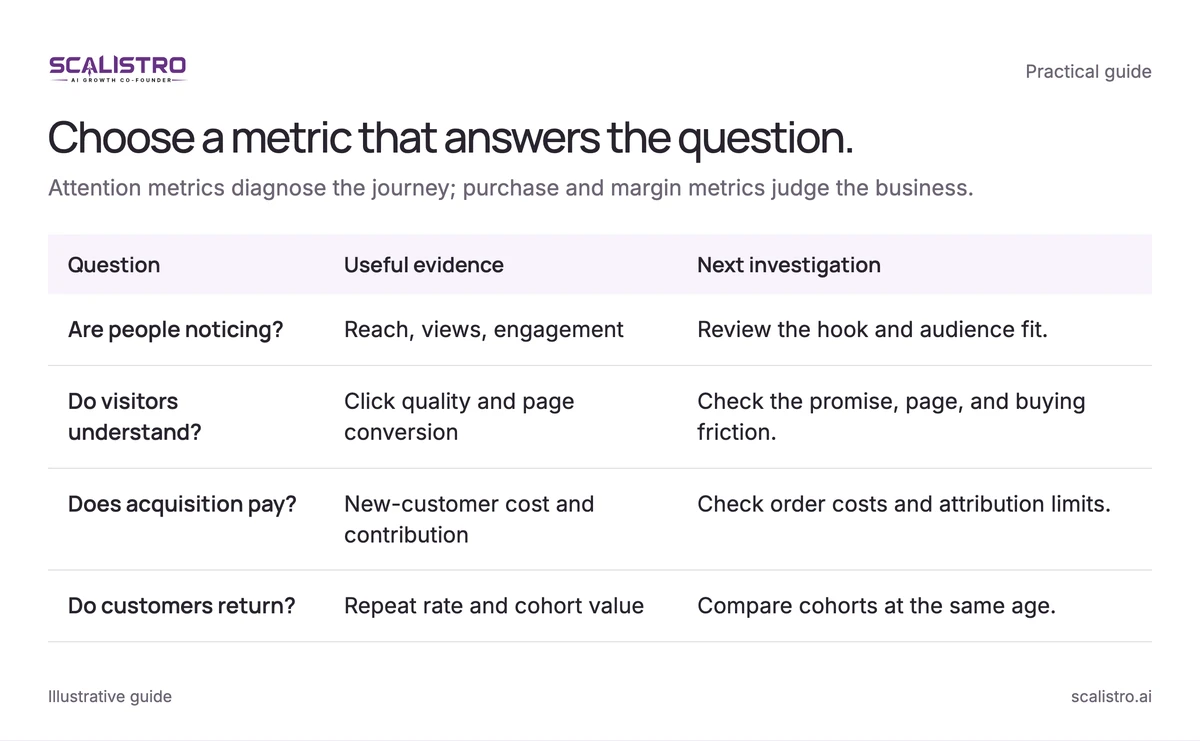
Swipe to explore. Tap to open full size.
Image details: Choose a metric that answers the question.
| Question | Useful evidence | Next investigation |
|---|---|---|
| Are people noticing? | Reach, views, engagement | Review the hook and audience fit. |
| Do visitors understand? | Click quality and page conversion | Check the promise, page, and buying friction. |
| Does acquisition pay? | New-customer cost and contribution | Check order costs and attribution limits. |
| Do customers return? | Repeat rate and cohort value | Compare cohorts at the same age. |
Customer Acquisition Tests
Testing more distinct creative ideas gives the ad platform more chances to find an angle that works. More options help only when they represent distinct ideas and each receives enough spend. AI tools can help a small team prepare variants; choose a weekly pace your review and media budget can sustain.
Most D2C acquisition budgets are concentrated on Meta. Many D2C brands put the largest share of acquisition spend on Meta (Facebook and Instagram), followed by Google, with smaller tests on TikTok and other channels. Heavy reliance on one platform makes CAC sensitive to that platform's auction and policy changes. Diversify once each added channel has enough budget to learn.
Retargeting audiences convert at higher rates than prospecting audiences. Shoppers who already visited your store usually convert at a higher rate than cold audiences, so retargeting often reports a higher platform ROAS than prospecting. Some of those purchases would have happened anyway. Keep most spend on prospecting to create new demand, and check incrementality with a holdout before increasing a retargeting budget that already reaches most eligible shoppers.
Most first-time visitors leave without buying, and many buyers return through several channels before their first order. Email, paid social, and SMS together give shoppers more ways back than a single channel. Map actual customer paths before assigning all credit to the final ad.
Short video ads are worth testing against static images for cold audiences. For cold audiences, short product demonstrations and creator clips can explain a product faster than a single image, but they cost more to make. Test a small set of 15 to 30 second videos against your best static ads, judge them on cost per purchase, and shift production budget only when video wins.
Conversion & Revenue Tests
A free-shipping threshold above your average order value can raise basket size. Setting the free-shipping threshold somewhat above your current AOV gives shoppers a reason to add an item. For a $55 order, test a $65 to $70 threshold. Compare contribution profit and abandonment across three levels over 2 to 4 weeks; a larger basket is not useful if shipping erases the margin.
Relevant upsell and cross-sell offers can raise revenue per session. Relevant bundles and complementary items can lift revenue per session. Put the suggestion where it helps a buyer complete a routine or set, and compare it with no widget. Measure whether post-purchase offers add margin rather than just discount an order that would have happened.
Subscriptions can raise 12-month customer value for repeat-purchase products. For products people reorder on a schedule, a subscription turns occasional purchases into regular ones. As an illustration, a $55 beauty product bought 2.2 times a year brings in $121, while 7 to 10 subscription orders bring in $385 to $550 before any discount. Check what remains after the subscription discount and any canceled orders before promoting it heavily.
Email & SMS Tests
Welcome series work better with a clear, genuine reason to buy now. A genuine, time-limited first-order offer gives new subscribers a reason to act. Use 4 to 6 messages over 7 to 10 days to explain the brand, product, proof, and deadline, and exclude buyers from the remaining first-purchase reminders.
Sending more campaigns can raise email revenue when you segment by engagement. Brands that send more often can earn more email revenue, but only when the extra messages reach people who want them. That is an account-level pattern, not a reason to send every message to everyone. Segment by engagement, purchase stage, and preference, then watch unsubscribe rate and revenue per recipient as frequency rises.
Segmented email campaigns earn more per recipient than unsegmented sends. Sending relevant messages to smaller groups usually earns more per recipient than one message to the whole list. Start with buyers versus non-buyers and engaged versus inactive contacts, then add behavior and preference segments. Keep the measurement window and holdout consistent so you can see the real lift.
Post-purchase email flows support repeat purchases. A post-purchase flow keeps new customers informed and gives them a reason to come back. Send order and delivery information first, then usage help, a review request, and a relevant next-product suggestion. Compare the repeat-purchase rate of customers who received the flow with a holdout group.
Social Media Tests
Short video is worth testing against static images on every social platform. Short video often earns more attention than static imagery, and one product demonstration can become several channel-specific edits. Compare engagement and site visits by format in your own accounts, and keep still images when they explain detail better than motion.
A steady posting rhythm gives social more chances to send visitors to your store. Posting consistently gives each platform more chances to show your content to buyers, so compare referral traffic at different posting rhythms in your own analytics. A calendar and Listro can help plan and draft a steady queue of posts, but preserve quality and respond to comments. Five weak posts are not automatically better than three useful ones.
Active social channels need a steady supply of unique content each month. Each active platform needs its own volume of posts, and production cost rises with every channel you add. Choose the platforms that reach actual buyers, budget production for them, and count approved, published assets rather than raw generations.
Ad Creative Tests
Winning ad creative wears out, so plan replacements before results drop. Rising frequency and falling click-through rate are common signs that an ad is wearing out with its audience. Prepare new variants where budget supports it, track seven-day frequency and CPA for each ad, and check CPA before retiring a winner based on age alone.
UGC-style creative is worth testing against polished brand creative for cold audiences. A conversational, creator-style opening can hold attention in a feed where polished ads look like ads. Start with a mix of creator-style and polished creative, then adjust it by funnel stage and purchase results rather than click-through rate alone.
Export video in both vertical (9:16) and square (1:1) formats to fit more placements. Different placements show different crops, so supplying both 9:16 vertical and 1:1 square video gives each placement a version that fits. Different placements show different crops, so inspect text, hands, and product details in each export. Reformatting tools save time, but the edit still needs a human placement check.
Dynamic creative testing needs distinct inputs to teach you anything. Dynamic creative can find stronger combinations faster than one-at-a-time A/B tests, but only when the inputs are genuinely different. Give the system distinct inputs, such as five headlines, three body-copy options, and four visuals, then inspect which combinations actually received spend. More possible combinations do not guarantee every one was tested fairly.
Check whether your creative budget matches the formats that drive revenue. Compare each format's share of creative spend with its share of ad revenue in your own account. If video drives most purchases but receives a small share of production budget, test moving more production toward video, using creator-led or AI-assisted processes to keep the cost per variant down. Check your own format profitability first.
Ads featuring real customers or founders are worth testing against stock models. Real founders and customers often explain a product more credibly than stock models, so test them against each other on purchase results. This can matter especially for brands below $5 million annual revenue, where a founder can explain the product more credibly than generic talent. Get customer permission and keep testimony accurate.
AI in Marketing Tests
AI-generated ad creative still needs human direction and review. AI can produce ad variations quickly, but output without a clear brief and human review tends to look generic and wear out sooner. Compare reviewed and unreviewed AI variations in your own account on results and on how long each one keeps working. Review product truth and distinctiveness before publishing.
AI tools can raise how much content each person produces. AI-assisted teams can produce more drafts per person. In the examples here, a manager moves from 15 posts to 50 to 75 a month, and a designer from eight to 25 to 40 weekly ad assets. Count approved, useful work and protect enough time for editing and testing.
AI plus human creative workflows combine speed with judgment. Combining AI production with human direction lets a team test more ideas while keeping product truth and brand fit under review. The repeatable process is a human brief, AI-generated options, human curation, a controlled test, and a new brief informed by purchases.
AI support tools can answer routine questions faster when a human handoff is clear. AI tools can handle routine order, return, and product questions quickly, which shortens response times for customers. Provide a clear human handoff for a wrong answer, complex problem, or upset customer, and track satisfaction alongside speed.
Measure AI cost savings against your own baseline. AI can lower the cost of producing each creative asset, but tool subscriptions and review time add cost back. Record your current cost per approved asset and total marketing cost before adopting a tool, then compare after a full quarter, including tool and review costs.
AI-assisted testing can shorten the decision cycle when measured correctly. Traditional A/B tests on low-traffic pages can take 2 to 4 weeks. Adaptive allocation may move more traffic to a promising version sooner, but a shorter decision cycle is not the same as statistical confidence. Define the success metric, sample, and stopping rule before the test.
AI is becoming core marketing infrastructure, not just a supplementary tool. Marketers increasingly treat AI as part of everyday infrastructure rather than an occasional add-on. A useful implementation still begins with a measurable task, a human owner, and a review gate. The goal is better decisions and more useful output, not the largest possible number of AI tools.
For help interpreting these figures, use the CAC, ROAS, LTV and conversion benchmark guide.