D2C Marketing Benchmarks 2026: CAC, ROAS, LTV and CVR
Compare sourced CAC, ROAS, conversion, and order value benchmarks, then judge each one against your margins, attribution, and customer lifetime value.
On this page
- Introduction
- Customer Acquisition Cost (CAC) by D2C Category
- ROAS by Advertising Platform
- Conversion Rates by Traffic Source
- Customer Lifetime Value (LTV)
- Email Marketing Benchmarks
- Social Media Engagement Rates by Platform
- Ad Creative Performance Benchmarks
- Mobile vs. Desktop Conversion Rates
- Average Order Value (AOV) by Category
- Frequently Asked Questions
Use benchmarks to locate a problem, then use your own margin and customer cohorts to decide what to change. This guide brings together published 2025 and 2026 benchmarks from Triple Whale, Ruler Analytics, Dynamic Yield, Klaviyo, Baymard Institute, and Rival IQ, linked beside each figure.
Ranges are more useful than one average because price, maturity, and channel mix differ. Compare like with like, then check the trend in your own account before moving budget.
Customer Acquisition Cost (CAC) by D2C Category
Customer acquisition cost is what you spent to win a new buyer. Published category CAC figures vary widely and rarely explain their method, so the closest reliable reference is platform cost per purchase. The table shows median Meta cost per purchase by industry from Triple Whale's August 2025 to July 2026 benchmarks, covering more than 40,000 brands.
| D2C Category | Median Meta Cost per Purchase | YoY Change |
|---|---|---|
| Beauty | $39.31 | +6.06% |
| Health & Wellness | $40.53 | +8.95% |
| Apparel & Accessories | $36.98 | +1.49% |
| Food & Beverage | $38.57 | +0.71% |
| Pets & Animals | $38.51 | +0.96% |
| Home & Garden | $47.93 | +6.71% |
How to read it: Cost per purchase counts every attributed order, including repeat buyers, so your new-customer CAC will usually be higher. Compare your blended CAC (all marketing spend divided by new customers) with your own history first, and use these medians to see whether Meta itself is getting more expensive in your category.
What to do: Calculate CAC monthly with a consistent definition of a new customer. If it stays well above your category's figure for two months, inspect the full funnel before raising spend. If you change how you produce and test creative, compare your monthly CAC for three months before and after the change.
ROAS by Advertising Platform
These are median ROAS figures from Triple Whale, measured with its own attribution across brands using its platform. Reported ROAS depends on attribution settings, so compare the same window and include contribution margin.
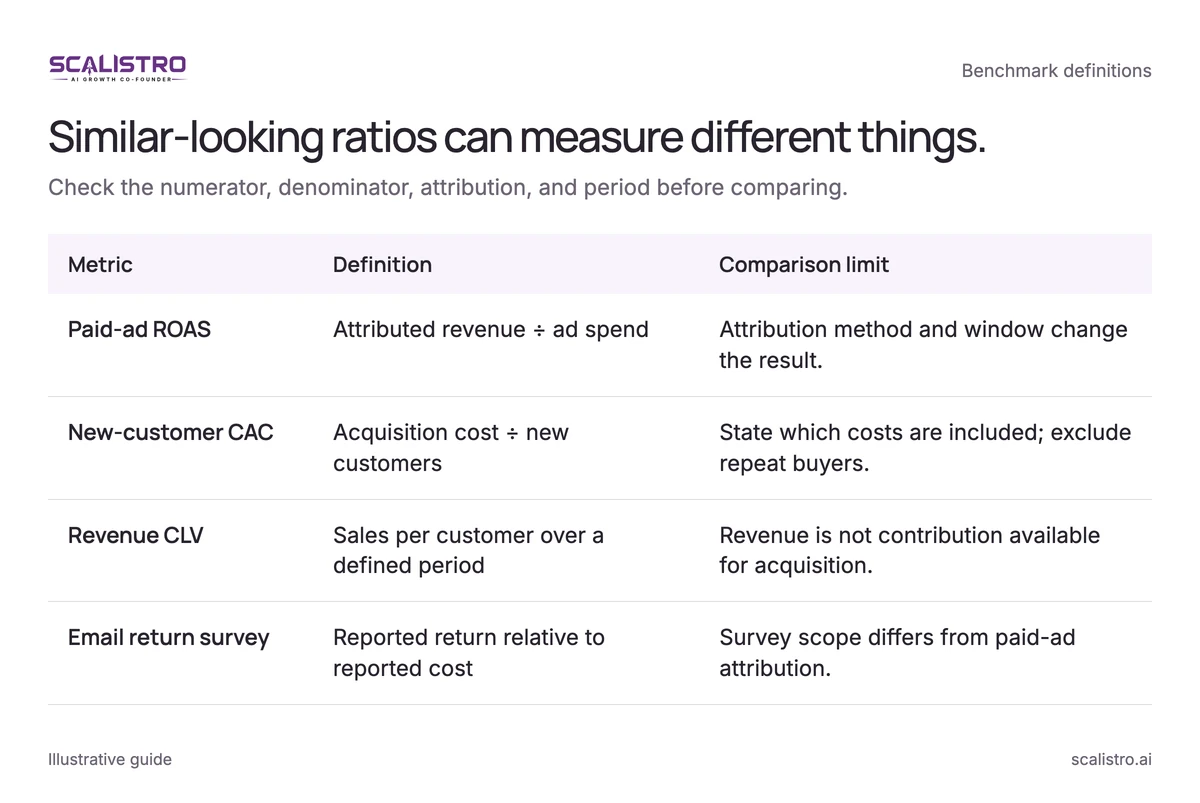
Swipe to explore. Tap to open full size.
Image details: Similar-looking ratios can measure different things.
| Metric | Definition | Comparison limit |
|---|---|---|
| Paid-ad ROAS | Attributed revenue ÷ ad spend | Attribution method and window change the result. |
| New-customer CAC | Acquisition cost ÷ new customers | State which costs are included; exclude repeat buyers. |
| Revenue CLV | Sales per customer over a defined period | Revenue is not contribution available for acquisition. |
| Email return survey | Reported return relative to reported cost | Survey scope differs from paid-ad attribution. |
| Platform | Median ROAS | Period | Source |
|---|---|---|---|
| Meta (Facebook + Instagram) | 1.88 | Aug 2025 to Jul 2026 | Triple Whale |
| Google Ads (all campaign types) | 3.27 | Aug 2025 to Jul 2026 | Triple Whale |
| TikTok Ads | 2.21 | Calendar 2025 | Triple Whale |
How to read it: Search reaches people looking for a product; social can introduce it earlier. Email return is measured differently: in Litmus's 2025 State of Email survey, 35 percent of marketers reported $10 to $36 back for every $1 spent and 30 percent reported $36 to $50. Those figures leave out much of the cost of building a list and making messages, so do not compare them directly with paid-ad ROAS.
What to do: Check platform results quarterly against your profitable threshold and business-level sales. If Meta weakens, inspect creative and the post-click path; if Search weakens, inspect queries and page relevance.
Conversion Rates by Traffic Source
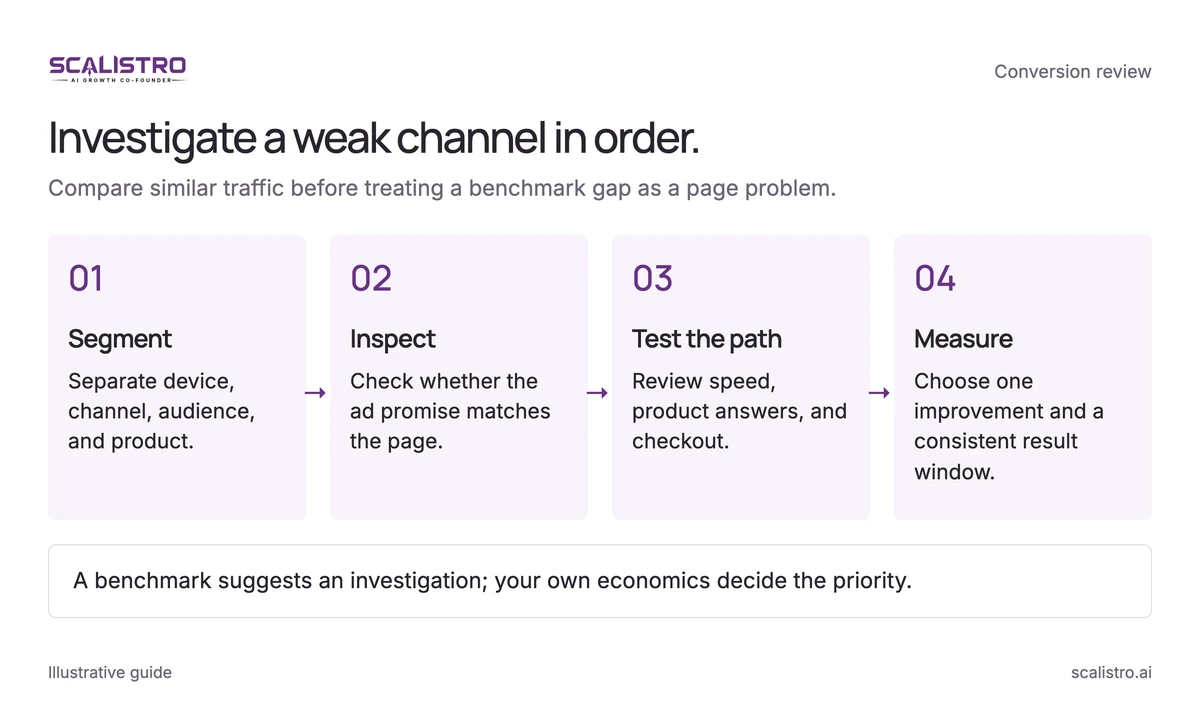
Traffic source changes buyer intent. Compare conversion rates by source to find a weak landing experience, not to demand the same rate from cold social and branded search.
Swipe to explore. Tap to open full size.
Image details: Investigate a weak channel in order.
Investigate a weak channel in order. Compare similar traffic before treating a benchmark gap as a page problem. Segment - Separate device, channel, audience, and product.; Inspect - Check whether the ad promise matches the page.; Test the path - Review speed, product answers, and checkout.; Measure - Choose one improvement and a consistent result window. A benchmark suggests an investigation; your own economics decide the priority.
The table shows retail and ecommerce conversion rates by channel from Ruler Analytics' 2026 benchmarks, based on more than 110 million sessions.
| Traffic Source | Retail & Ecommerce Conversion Rate | Key Driver |
|---|---|---|
| Organic Search | 2.0% | Content relevance, page speed |
| Paid Search | 2.1% | Keyword intent matching |
| Paid Social | 2.3% | Ad-to-landing page congruence |
| 2.3% | Segmentation, personalization | |
| Direct | 2.3% | Brand strength, repeat customers |
| Referral | 2.0% | Partner and creator fit |
| Social Organic | 1.74% | Content quality, follower loyalty |
How to read it: The channels sit closer together in this data than many expect, so a channel far below its benchmark usually points to the landing experience. Check whether the ad promise, page content, speed, and checkout agree before blaming the audience.
What to do: Start with the highest-volume source that converts below its benchmark. Moving a 50,000-visitor channel from 0.8 to 1.5 percent conversion adds 350 orders before any change in traffic, a larger opportunity than a small channel with a similar rate problem.
Customer Lifetime Value (LTV)
Twelve-month customer value sets a ceiling on what acquisition can cost. Compare subscription and non-subscription buyers separately, and include gross margin when turning revenue LTV into a spend limit. The customer lifetime value guide shows how to calculate it from your own orders.
How to read it: We did not find a published, method-backed source for 12-month customer value by D2C category, so use your own cohorts as the benchmark. A ratio such as 3:1 means a customer spends three times what it cost to bring them in over 12 months, before product and delivery costs. Set your target from gross margin, not from a market average.
What to do: Track 12-month value by acquisition cohort. If a recent cohort falls below your earlier cohorts, improve the product experience and follow-up before buying more of the same customers. A 20 percent value lift and a 20 percent CAC reduction both improve the relationship, but they are not mathematically identical in every profit model.
Email Marketing Benchmarks
Compare broadcast campaigns with behavior-triggered flows separately. They reach customers at different moments and should have different expectations.
| Metric | Campaign Emails (avg / top 10%) | Automated Flows (avg / top 10%) |
|---|---|---|
| Open Rate | 37.93% / 54.78% | 48.57% / 65.74% |
| Click Rate | 1.29% / 4.74% | 4.67% / 12.21% |
| Placed Order Rate | 0.08% / 0.44% | 1.42% / 4.93% |
| Revenue per Recipient (avg) | $0.10 | $1.68 |
Figures are from Klaviyo's 2025 Benchmark Report across ecommerce industries. Klaviyo notes that Apple's 2021 privacy change inflates open rates, so lean on clicks and orders. For spam complaints, Google's sender guidelines ask bulk senders to stay below 0.10 percent and never reach 0.30 percent.
How to read it: Emails sent after an action tend to do better than general campaigns. If automated emails bring in a small share of email revenue, check whether key messages are missing. At 100,000 emails a month, raising revenue per send from $0.06 to $0.12 adds $6,000 monthly revenue.
What to do: Check the welcome, cart, browse, post-purchase, and win-back flows first. The working ranges are 4 to 6, 3, 2, 3 to 4, and 3 emails respectively. Test subject lines and timing after the messages and exclusions are correct.
Social Media Engagement Rates by Platform
These are median engagement rates per post, by follower, across 2,100 brands in 14 industries from Rival IQ's 2025 Social Media Industry Benchmark Report. Use reach, saves, shares, and customer replies to judge whether the content is reaching the right people.
| Platform | Median Engagement Rate per Post |
|---|---|
| TikTok | 1.73% |
| 0.36% | |
| 0.046% | |
| X (Twitter) | 0.015% |
How to read it: Engagement rates are much lower than many guides suggest, and every platform fell year over year in Rival IQ's data. TikTok still leads, and on Instagram carousels outperformed Reels. Keep Facebook organic work where a real community responds to it.
What to do: Test a mix with at least 60 percent short-form video if your product can be demonstrated well. Listro can help prepare content for connected channels. Measure any time saving against your own production baseline.
Ad Creative Performance Benchmarks
Use the hook, hold, click, and purchase metrics together. Each diagnoses a different part of the ad.
| Metric | What It Diagnoses | Meta Median (Aug 2025 to Jul 2026) |
|---|---|---|
| Hook Rate (3-sec video views / impressions) | The opening | Track against your own account |
| Hold Rate (ThruPlays / 3-sec views) | The body of the video | Track against your own account |
| CTR | The offer and call to action | 2.39% |
| CPM | Cost of reach | $15.06 |
| Conversion Rate | The landing page and offer | 1.53% |
Meta medians are from Triple Whale's benchmarks across more than 40,000 brands.
How to read it: Low hook rate points to the opening; low hold rate after a strong hook points to the body; low CTR after good viewing points to the offer or CTA. Ads wear out as frequency rises, so plan fresh tests before the current winner weakens.
What to do: Plan 5 to 10 new weekly variants when budget supports them. A hook rate well below your account's usual level after a few thousand impressions calls for a new opening; CTR above the 2.39 percent Meta median and ROAS above your target make a candidate worth testing at more spend. Use purchases to make the final decision.
Mobile vs. Desktop Conversion Rates
Mobile brings most ecommerce visits, which makes the phone checkout and page load path a high-value place to investigate.
| Metric | Mobile | Desktop | Tablet |
|---|---|---|---|
| Share of Ecommerce Traffic | 75.67% | 23.33% | 1% |
| Conversion Rate (August) | 2.88% | 2.31% | 2.82% |
Traffic share and conversion rates are from Dynamic Yield's device usage and conversion rate benchmarks. Across all devices, Baymard Institute puts average cart abandonment at 70.22 percent. Google's Core Web Vitals treat a Largest Contentful Paint within 2.5 seconds as good on both mobile and desktop.
How to read it: About three quarters of traffic is mobile, and in Dynamic Yield's recent data mobile converts at least as well as desktop. If your mobile rate trails desktop by a wide margin, the phone experience is the first place to look. At 100,000 monthly mobile visitors, 2 percent conversion, and $65 AOV, revenue is $130,000. A 0.5 percentage-point lift adds $32,500 a month, or $390,000 a year, before other changes.
Average Order Value (AOV) by Category
Compare order value with CAC and gross margin. A higher AOV helps only if bundles and upsells preserve the profit on each order.
| D2C Category | Median AOV (Meta-attributed orders) | Effective AOV Tactic |
|---|---|---|
| Beauty | $61.23 | Bundles + Routine builder |
| Health & Wellness | $61.08 | Subscribe & save, multi-pack |
| Apparel & Accessories | $86.27 | Complete-the-look, free shipping threshold |
| Food & Beverage | $64.32 | Variety packs, subscription boxes |
| Pets & Animals | $59.31 | Starter kits, auto-ship |
| Home & Garden | $110.41 | Room collections, upsell widgets |
Median order values are from Triple Whale's Meta benchmarks, August 2025 to July 2026.
How to read it: If AOV sits below your category's figure, check first-order contribution against CAC. Free-shipping thresholds 15 to 25 percent above current AOV and relevant bundles are common tests.
If acquisition cost is the constraint, follow the guide to reducing D2C CAC before raising spend.