D2C Customer Lifetime Value: Calculate and Grow It
Learn what a D2C customer is worth over time, how to calculate it from repeat orders, and how to encourage customers to buy again.
On this page
- Introduction
- What Is Customer Lifetime Value and Why It Matters
- How to Calculate Customer Lifetime Value: 4 Methods
- Build Your Own CLV Benchmarks
- 12 Ways to Improve Customer Lifetime Value
- Strategy 1: Optimize the Post-Purchase Experience
- Strategy 2: Implement a Subscription or Replenishment Model
- Strategy 3: Build a Loyalty and Rewards Program
- Strategy 4: Personalized Email and SMS Flows
- Strategy 5: Strategic Cross-Selling and Bundling
- Strategy 6: Improve Product Quality and Expand Assortment
- Strategy 7: Invest in Community Building
- Strategy 8: Referral Programs
- Strategy 9: Reduce Churn with Win-Back Campaigns
- Strategy 10: Improve Customer Support Response Times
- Strategy 11: Use AI for Personalization at Scale
- Strategy 12: Track and Optimize CLV by Acquisition Channel
- CLV and CAC: The Ratio That Determines D2C Success
- Frequently Asked Questions
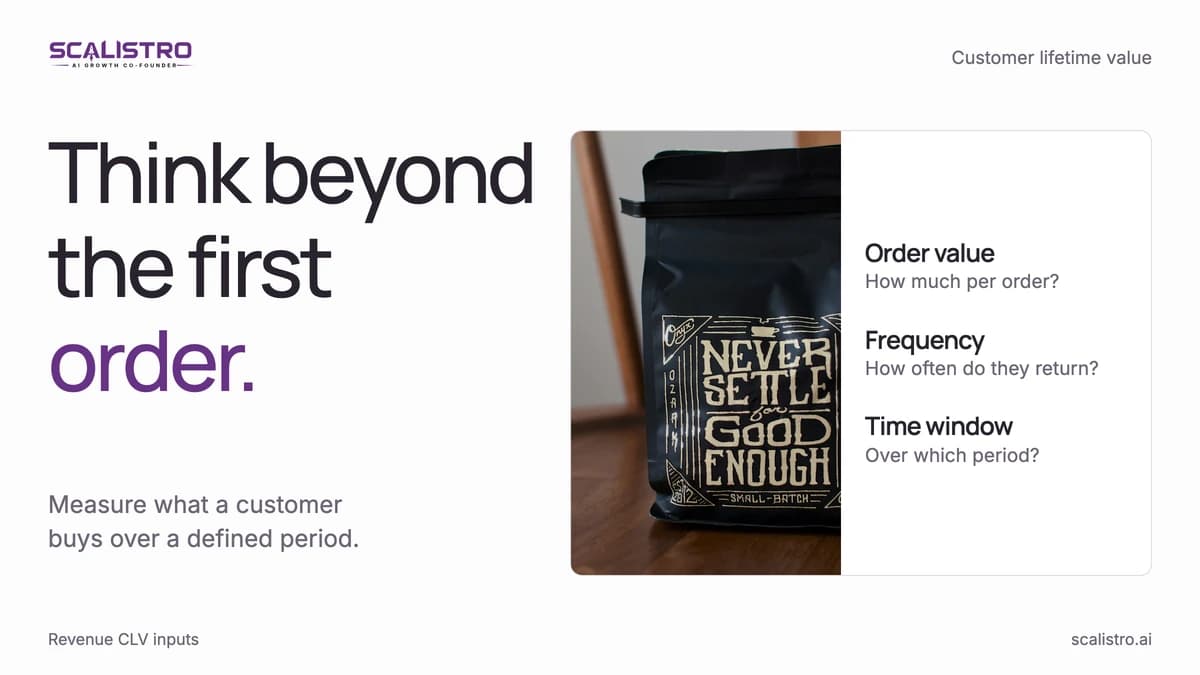
D2C customer lifetime value is how much one customer buys from you over time. You may also see it called CLV or LTV. Without it, you cannot tell whether the cost of bringing in a new buyer is worth it.
Say a skincare customer spends $45 per order and buys 4.2 times in two years. That is $189 in sales ($45 x 4.2). If the brand paid $38 to get that customer, the sales are about five times the ad cost. That is not five times the profit. The brand still pays for the product, delivery, returns, and support.
Here is how to calculate the number and help customers come back.
What Is Customer Lifetime Value and Why It Matters
When you share a CLV number, say whether it covers one year, two years, or the full customer relationship. Also say whether it means sales or money left after costs. For example, $200 in sales over two years is not the same as $200 left after product and delivery costs.
CLV helps with four decisions:
- How much to spend on ads: If a customer leaves $150 after order costs and costs $50 to acquire, you get a 3-to-1 return before overhead. Use money left after costs for this comparison, not sales alone.
- When the money comes back: SimplicityDX estimated that merchants lost an average of $29 on each new customer acquired in 2022, up from $9 in 2013 (SimplicityDX, 2022). Repeat sales help only if they happen soon enough.
- Business strength: Investors often ask for the customer-value-to-acquisition-cost ratio, and they look at how the number was calculated.
- Which channel brings better buyers: Customers from different channels can be worth very different amounts. Compare customers who have had the same amount of time to buy again.
How to Calculate Customer Lifetime Value: 4 Methods
Method 1: Simple CLV Formula
For an early estimate, keep the frequency and lifespan units consistent:
Swipe to explore. Tap to open full size.
Image details: Keep the units and costs visible.
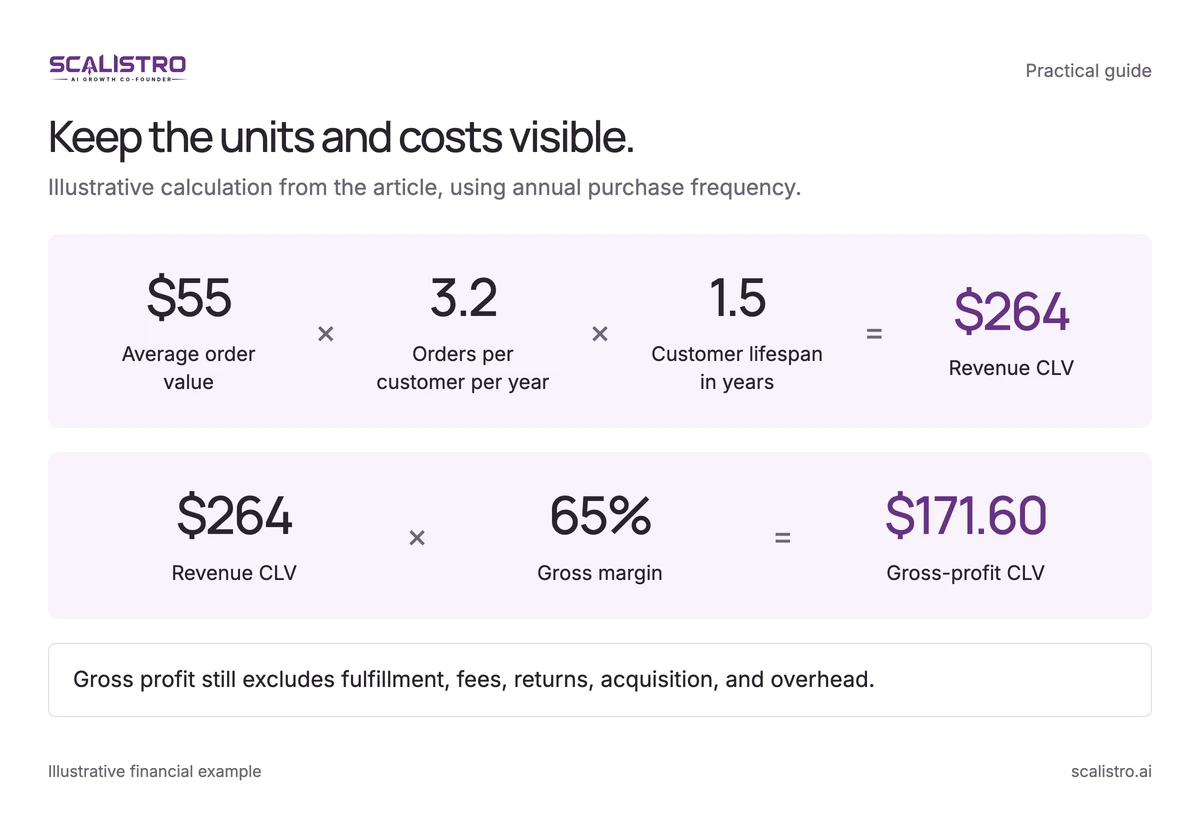
Keep the units and costs visible. Illustrative calculation from the article, using annual purchase frequency. $55 (Average order value) × 3.2 (Orders per customer per year) × 1.5 (Customer lifespan in years) = $264 (Revenue CLV); $264 (Revenue CLV) × 65% (Gross margin) = $171.60 (Gross-profit CLV) Gross profit still excludes fulfillment, fees, returns, acquisition, and overhead.
Revenue CLV = Average Order Value x Orders per Customer per Year x Customer Lifespan in Years
If AOV is $55, customers buy 3.2 times per year, and the average relationship lasts 18 months (1.5 years):
CLV = $55 x 3.2 x 1.5 = $264
This $264 estimate is revenue, not profit. Do not multiply by lifespan again if your purchase count already covers the entire relationship.
Method 2: Gross Margin CLV
A margin-based version starts to show what is available to pay for acquisition:
Gross-profit CLV = AOV x Gross Margin % x Orders per Customer per Year x Lifespan in Years
Example: Same brand with a 65% gross margin:
CLV = ($55 x 0.65) x 3.2 x 1.5 = $35.75 x 3.2 x 1.5 = $171.60
The $171.60 result is gross profit before fulfillment, fees, returns, acquisition, and overhead. Subtract expected variable costs to estimate contribution CLV.
Method 3: Follow Each Month's New Customers
Group customers by the month they first bought. Then watch how much each group spends over time:
Swipe to explore. Tap to open full size.
Image details: Compare customers at the same age.
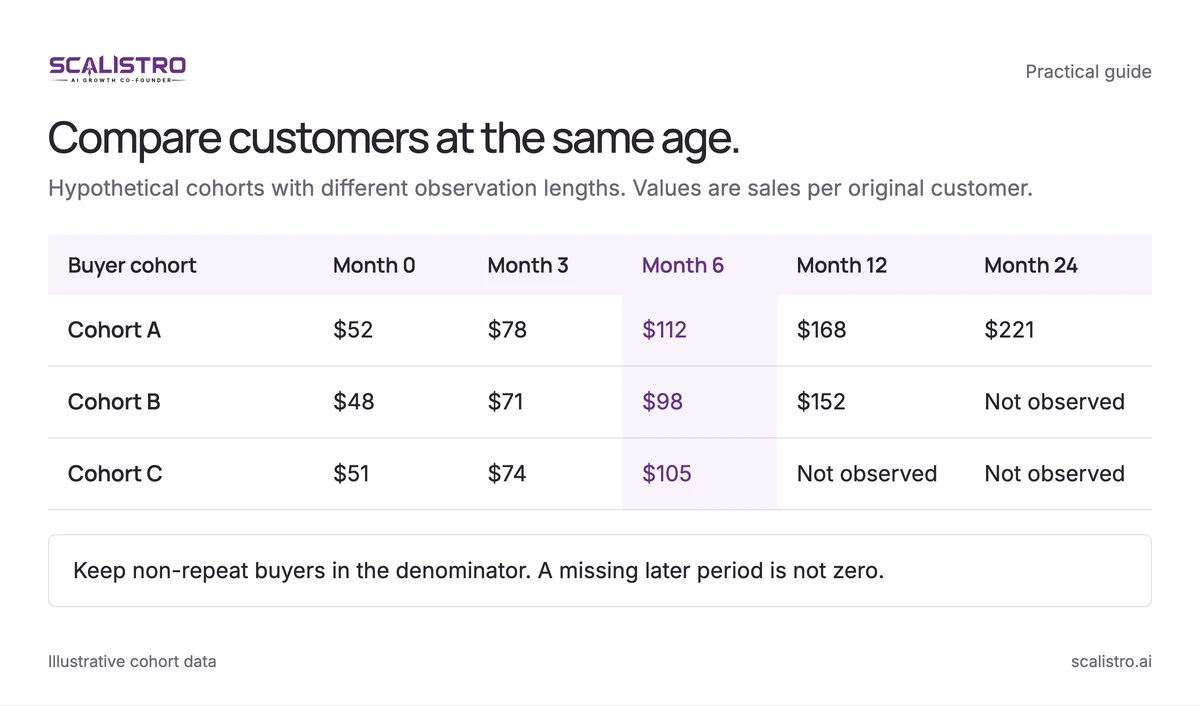
| Buyer cohort | Month 0 | Month 3 | Month 6 | Month 12 | Month 24 |
|---|---|---|---|---|---|
| Cohort A | $52 | $78 | $112 | $168 | $221 |
| Cohort B | $48 | $71 | $98 | $152 | Not observed |
| Cohort C | $51 | $74 | $105 | Not observed | Not observed |
Keep non-repeat buyers in the denominator. A missing later period is not zero.
- Put everyone who first bought in January in one group, February in another, and so on.
- Add each group's sales after 3, 6, 12, 18, and 24 months.
- Divide by the number of customers who started in that group, including those who never bought again.
- Compare groups at the same age before estimating future sales.
This hypothetical skincare example compares cohorts with different observation lengths:
| Buyer cohort | Month 0 (First Order) | Month 3 | Month 6 | Month 12 | Month 24 |
|---|---|---|---|---|---|
| Cohort A (1,200 customers) | $52 | $78 | $112 | $168 | $221 |
| Cohort B (1,450 customers) | $48 | $71 | $98 | $152 | Not observed |
| Cohort C (1,800 customers) | $51 | $74 | $105 | Not observed | Not observed |
At six months, Cohort A customers had spent $112 each and Cohort B customers had spent $98 each. Look at what products they bought and where they came from before deciding why. An unobserved later month means that period is not yet available for the cohort.
Method 4: Estimate Future Customer Value
If you have enough past orders, a model can estimate which new buyers may spend more later. Check the prediction against what buyers actually do before using it to guide ad spend.
Key predictive signals:
- Time to second purchase: Compare long-term spend for buyers who return within 30 days with those who wait 90 days or more.
- First-order AOV: Check whether above-median first orders lead to higher 12-month CLV in your data.
- Product category: Compare customers whose first order was a replenishable product with those who started with a one-time product.
- Where they came from: Search and referral customers may spend more than paid-ad customers. Different channels may attract different buyers.
Build Your Own CLV Benchmarks
Published CLV benchmarks by category rarely state their method or sample, so use your own cohorts as the benchmark. Track 12-month and 24-month value, repeat purchase rate, and orders per customer by first-order category, and compare each new cohort with earlier ones.
12 Ways to Improve Customer Lifetime Value
Strategy 1: Optimize the Post-Purchase Experience
After a first order, send a clear delivery estimate, tracking, useful product tips, and a feedback request once the customer has tried it. Check whether your own emails make the difference.
Strategy 2: Implement a Subscription or Replenishment Model
If customers use up your product, offer delivery when they are likely to need more. Compare subscribers' spend with one-time buyers in your own data. A 10-15% discount can help, but it must still leave enough profit per order.
Strategy 3: Build a Loyalty and Rewards Program
Give members something useful, such as early access or free shipping above a sensible order size. Check whether the program causes more repeat orders or mostly rewards people who already bought often.
Strategy 4: Personalized Email and SMS Flows
Segmented email earns more than one message sent to everyone: in Klaviyo's Q4 2017 data, highly segmented lists returned $0.19 per recipient versus $0.06 for unsegmented lists (Klaviyo, 2017 data). Start with product tips, reminders to reorder, relevant add-ons, and a message for buyers who have not returned. Do not claim every later order came from the email; compare with customers who did not receive it.
Strategy 5: Strategic Cross-Selling and Bundling
Suggest products that go together. Relevant add-ons and bundles can raise order size, but check what remains after the discount and extra shipping.
Strategy 6: Improve Product Quality and Expand Assortment
Fix defects and return reasons before expanding the catalog. New products help only when they solve another problem for the same customer and do not create excess inventory.
Strategy 7: Invest in Community Building
Engaged community members often buy again and refer friends. Track repeat-purchase and referral rates for members against other customers to see whether that holds for your brand. Build a group around something customers want to discuss, then see whether members actually buy or refer more after joining.
Strategy 8: Referral Programs
A study of about 10,000 bank customers found referred customers were at least 16 percent more valuable than comparable customers, with higher retention (Schmitt, Skiera and Van den Bulte, 2011). If you run a "Give $15, Get $15" program, include both reward costs when calculating referred-customer CAC. Attribute the friend's orders to the new customer, not to the referrer's purchase CLV.
Strategy 9: Reduce Churn with Win-Back Campaigns
Harvard Business Review cites estimates that acquiring a new customer is 5 to 25 times more expensive than retaining an existing one (HBR, 2014). Identify lapse from the product's natural reorder interval, then test win-back messages. Compare discount, gift, and product-news offers; the offer that wins back the most customers may not leave the best margin.
Strategy 10: Improve Customer Support Response Times
Clear return terms, prompt replies, and proactive order updates reduce avoidable friction. A negative service experience can cut future spend, making complaint resolution a retention issue as well as a support metric.
Strategy 11: Use AI for Personalization at Scale
Personalized recommendations, email, and ad creative can raise CLV when they are relevant. Use purchase history and explicit preferences to make a useful recommendation, then let a person review the message and product claim. Scalistro can help create relevant marketing assets; the store still needs its own customer data, consent, and retention measurement.
Strategy 12: Track and Optimize CLV by Acquisition Channel
Compare customers from each channel after the same amount of time. A buyer from content who leaves $300 after order costs and cost $45 to attract may be more valuable than a paid-social buyer who leaves $80 and cost $25. Check that you have enough buyers in each group before shifting budget.
CLV and CAC: The Ratio That Determines D2C Success
| CLV:CAC Ratio | What It Means | Action |
|---|---|---|
| Below 1:1 | Acquisition exceeds estimated contribution | Recheck the cohort window and pause unprofitable scaling. |
| 1:1 to 2:1 | Thin room for overhead and error | Improve contribution margin, retention, or CAC before raising spend. |
| 3:1 to 4:1 | Healthy planning range | Scale cautiously while watching payback and cohort quality. |
| 5:1 and above | Strong ratio on this measure | Check whether acquisition is constrained and whether more spend remains profitable. |
Use D2C email flows to test whether repeat purchases can improve lifetime value.