How to Lower Customer Acquisition Cost for D2C Brands
Learn how D2C brands can spend less to win each new customer by improving ads, product pages, offers, and tracking.
On this page
- Introduction
- Why CAC Keeps Rising and What You Can Do About It
- Strategy 1: Increase Creative Volume and Testing Velocity
- Strategy 2: Fix Your Attribution Before You Fix Your Ads
- Strategy 3: Optimize Your Landing Pages for Conversion Rate
- Strategy 4: Build an Organic Content Engine
- Strategy 5: Implement Referral and Word-of-Mouth Programs
- Strategy 6: Retarget Smarter, Not Harder
- Strategy 7: Leverage Lookalike Audiences Built on LTV, Not Just Purchases
- Strategy 8: Negotiate Better Unit Economics Before Scaling
- Strategy 9: Use AI to Review Ad Results
- Strategy 10: Increase Repeat Purchases to Improve Profit
- Strategy 11: Diversify Acquisition Channels Strategically
- Putting It All Together: A 90-Day CAC Reduction Plan
- Frequently Asked Questions
To lower customer acquisition cost for a D2C brand, first calculate it: divide what you spent on ads by the number of new buyers those ads brought in. This is often called CAC. For reference, Triple Whale's median Meta cost per purchase from August 2025 to July 2026 was $40.53 for health and wellness, $39.31 for beauty, $38.57 for food and beverage, and $36.98 for apparel and accessories (Triple Whale, 2026). Those medians count every attributed order, including repeat buyers, so your cost per new buyer will usually be higher.
You can lower CAC with better ads, a clearer product page, or less wasted spending. Getting a customer to buy again helps profit, but it does not change what you paid to bring them in the first time.
Why CAC Keeps Rising and What You Can Do About It
Five things can make each new buyer more expensive:
- Harder tracking: Privacy changes reduced the purchase data ad platforms can see, and competition keeps pushing ad prices up. Triple Whale's median Meta CPM rose 13.24 percent year over year to $15.06 for August 2025 to July 2026 (Triple Whale, 2026).
- More competitors: Far more brands now sell online than a few years ago, and many bid for the same audiences.
- Ads tiring faster: Some winning ads slow down after 7-10 days, compared with 3-6 weeks in older data. Replace an ad when its results fall, not simply when a calendar says so.
- Service costs: Shipping, returns, and support affect how much margin remains to cover CAC.
- Channel complexity: Each platform needs suitable creative and measurement. Adding a channel without enough budget or operational capacity can increase cost.
Start with your largest problem rather than trying every tactic at once.
Strategy 1: Increase Creative Volume and Testing Velocity
An ad that shows the product clearly and gives people a reason to care can bring in better buyers. In Nielsen's 2017 analysis of 500 campaigns, creative accounted for 47 percent of a campaign's contribution to sales, while targeting contributed 9 percent (Recast, citing Nielsen 2017).
Testing more distinct ideas gives you more chances to find a winner. Try new opening lines, product images, or offers. If your budget is small, run fewer tests so each gets a fair chance.
Listro can help a small team make more ad options from approved product images and brand rules. Keep a person choosing the final ads, then check whether the extra tests bring in profitable buyers.
Strategy 2: Fix Your Attribution Before You Fix Your Ads
Ad platforms may claim credit for sales that would have happened anyway. Reported sales and the sales ads truly added can differ widely. To check, compare a group that sees the ads with a similar group that does not.
Fixing tracking changes your reported CAC first. It does not automatically make ads cheaper. In some campaigns, the real cost of an extra buyer is higher than the platform report suggests; in others it is lower.
Practical steps to fix attribution:
- Compare two groups: Show the ad to one audience or region and hold it back from a similar one. Compare total sales, not just platform-reported sales.
- Check purchase tracking: Meta Conversions API can capture purchase events the browser pixel misses. Make sure one order is not counted twice and respect customer consent.
- Use post-purchase surveys: Add a "How did you hear about us?" question to your order confirmation page. This first-party data is imperfect but provides a valuable signal that platform data misses.
- Consider a reporting tool: These add a monthly cost. They help compare channels, but only a well-designed test can show how many sales the ads added.
Strategy 3: Optimize Your Landing Pages for Conversion Rate
If 100 visitors cost $100, a page where 2.5% buy costs $40 per order. At 5%, it costs $20. Littledata's benchmark of 421 Shopify stores puts the median conversion rate at 1.4 percent of sessions, with the top 20 percent at 2.6 percent or above (Littledata, 2026). Use your own starting rate when judging a change.
The highest-impact CRO changes for D2C landing pages:
- Speed: In Portent's research, a site that loads in 1 second had an ecommerce conversion rate 2.5 times higher than a site that loads in 5 seconds (Portent, 2022). Google treats a Largest Contentful Paint within 2.5 seconds as good (web.dev).
- Social proof above the fold: Northwestern's Spiegel Research Center found that displaying reviews raised conversion 190 percent for a lower-priced product and 380 percent for a higher-priced one (Spiegel Research Center, 2017).
- Specific headlines: Explain a supported product benefit without inventing a guarantee.
- Simpler checkout: Shopify reports that Shop Pay lifts conversion by up to 50 percent relative to guest checkout (Shopify, 2023). Remove fields only when fulfillment and compliance still work.
Strategy 4: Build an Organic Content Engine
Useful articles, videos, and email can bring in buyers without paying for every click. They still take time and money to make. Count content production costs too.
Short-form video can demonstrate a product quickly. A successful Reel can reach far beyond your followers, but results vary widely, so treat reach as an upside case, not a production plan. If Reels bring visitors, check whether those visitors buy.
In Ruler Analytics' 2026 benchmarks, organic search traffic to retail and ecommerce sites converted at 2.0 percent (Ruler Analytics, 2026). Search visits have no media click charge, but content and technical upkeep have costs. Prioritize queries connected to products and buyer questions.
Strategy 5: Implement Referral and Word-of-Mouth Programs
A study of about 10,000 bank customers found referred customers were at least 16 percent more valuable than comparable customers, with higher retention (Schmitt, Skiera and Van den Bulte, 2011). The cost of a referred customer should include both sides of the reward, administration, fraud, and any media used to promote it. Referral quality can also reflect who chooses to recommend the brand.
Effective referral program benchmarks for D2C:
- Referral participation rate: the share of customers who make at least one referral. Track it monthly.
- Referral conversion rate: the share of referred visitors who buy. Compare it with cold paid traffic.
- Optimal incentive: A dual-sided incentive, where both referrer and referee get a reward, is a common starting point. Test the reward size against your margin.
- Best timing: Trigger the referral ask 3 to 7 days after delivery, when product satisfaction is highest.
Strategy 6: Retarget Smarter, Not Harder
Someone who left a product in the cart is closer to buying than someone who read one blog post. Show them different ads if each group is large enough. Check whether the ads actually add sales.
Build these retargeting segments with decreasing funnel proximity:
- Cart abandoners, days 0-3: Answer the likely checkout objection with delivery, returns, or genuine offer details. A starting allocation is 40% of retargeting spend.
- Product viewers, days 0-7: Show the viewed product with real reviews or a demonstration. A starting allocation is 30%.
- Other site visitors, days 7-14: Use education or a clear brand story. A starting allocation is 20%.
- Engaged social viewers, days 14-30: Introduce the product before asking for a purchase. A starting allocation is 10%.
Strategy 7: Leverage Lookalike Audiences Built on LTV, Not Just Purchases
Most D2C brands build their lookalike audiences from a "all purchasers" seed. This includes one-time bargain hunters, discount-driven buyers, and customers who returned their order. A better approach: build your seed audience from your top 10 to 20 percent of customers by lifetime value.
When building a lookalike audience, try starting with your best customers instead of everyone who bought once. Use a permitted customer list, ideally around 1,000-5,000 people, and compare it with broad targeting.
Strategy 8: Negotiate Better Unit Economics Before Scaling
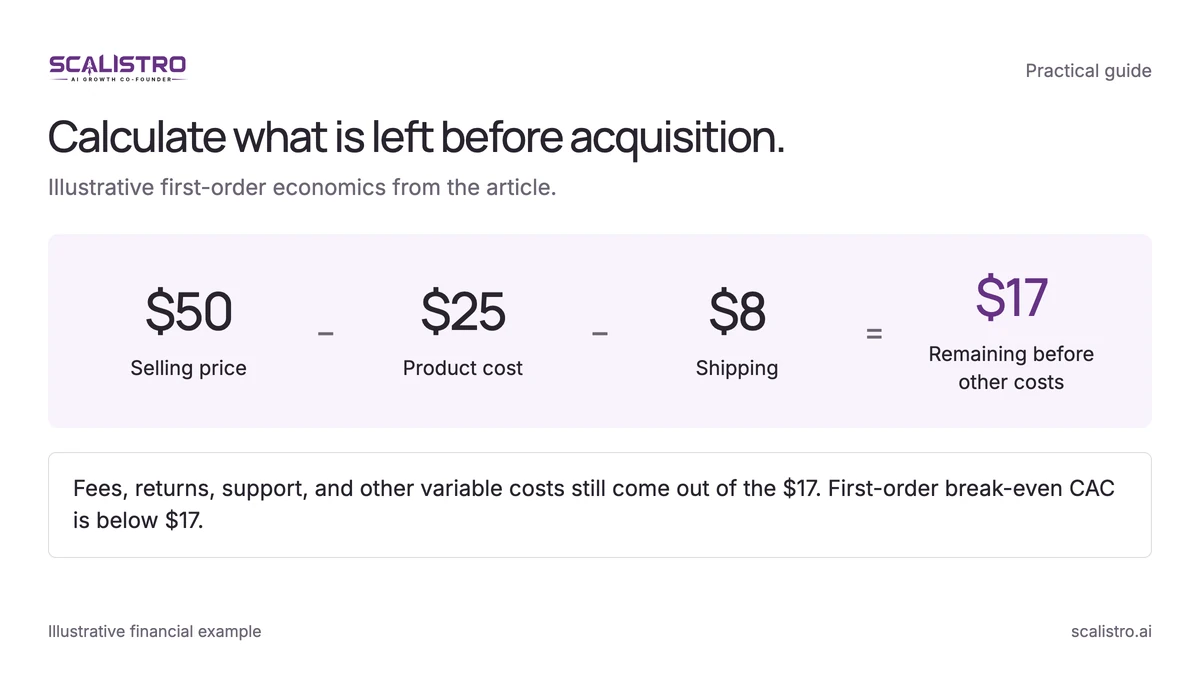
If a product sells for $50, costs $25 to make, and $8 to ship, $17 remains before payment fees, returns, support, and acquisition. The first-order break-even CAC is therefore below $17. A brand can choose a longer payback period, but it needs evidence of repeat orders and cash to fund the gap.
Swipe to explore. Tap to open full size.
Image details: Calculate what is left before acquisition.
Calculate what is left before acquisition. Illustrative first-order economics from the article. $50 (Selling price) − $25 (Product cost) − $8 (Shipping) = $17 (Remaining before other costs) Fees, returns, support, and other variable costs still come out of the $17. First-order break-even CAC is below $17.
Before investing in CAC reduction tactics, check your unit economics:
- COGS optimization: A 10% cut in $25 unit COGS releases $2.50 of first-order contribution, not a universal 10% increase in allowable CAC.
- Shipping cost reduction: Negotiated carrier rates or a 3PL can lower the cost per order. Multiply any saving by monthly orders to see the margin it frees.
- AOV improvement: A $50 to $65 AOV change is 30% more revenue, but the CAC ceiling rises only by the added contribution after extra product and fulfillment costs.
- Price optimization: A $5 price increase on a $50 product is a 10 percent increase in revenue per order. Test whether conversion falls by less than the added margin before rolling it out.
Strategy 9: Use AI to Review Ad Results
Media buyers can spend much of their week on reports and routine campaign work. Listro can help them see what changed in connected ad results and what to check next. A person still decides what to do in the ad platform.
Measure any AI workflow against your own baseline: CPA, hours spent on reporting, and the number of creative tests your team can run and review.
Set spending limits in the ad platform. Use connected results to spot a problem, then have the account owner make any bid or budget change.
Strategy 10: Increase Repeat Purchases to Improve Profit
If you paid $50 for a new buyer, that cost remains $50 even if they return. Across three orders, it works out to $16.67 per order. More repeat buying can improve overall profit and lower marketing cost as a share of sales. Keep it separate from CAC for new buyers.
Ways D2C brands can bring customers back:
- Post-purchase email flows: A 5-email post-purchase sequence (thank you, shipping confirmation, delivery follow-up, product education, cross-sell) supports repeat purchases. Measure its effect against a holdout group.
- Subscription or auto-replenishment: For consumable products, a subscription option can bring recurring orders, spreading acquisition spending across more sales.
- Loyalty programs: A well-designed loyalty program can raise repeat purchases. The most effective programs use a points-per-dollar model with status tiers that unlock exclusive benefits.
- Win-back campaigns: Automated win-back flows targeting customers who have not purchased in 60 to 90 days can bring back lapsed customers at lower cost than winning new ones. Harvard Business Review cites estimates that acquiring a new customer is 5 to 25 times more expensive than retaining an existing one (HBR, 2014).
Strategy 11: Diversify Acquisition Channels Strategically
When 80% of new customers come from one ad platform, pricing or account disruption can affect the whole acquisition plan. Spreading spend does not mean every brand should split a small budget three ways. Add a channel only when the team can run and measure it well.
The mix below is an illustrative benchmark, not a required allocation. Rebalance by incremental contribution and inventory:
| Monthly Ad Spend | Primary Channel | Secondary Channel | Tertiary Channel |
|---|---|---|---|
| $3,000 - $10,000 | Meta Ads (70-80%) | Google Shopping (20-30%) | - |
| $10,000 - $30,000 | Meta Ads (50-60%) | Google (25-30%) | TikTok Ads (10-15%) |
| $30,000 - $100,000 | Meta Ads (40-50%) | Google (25-30%) | TikTok (15-20%) + Pinterest (5-10%) |
| $100,000+ | Meta Ads (35-40%) | Google (20-25%) | TikTok (15-20%) + YouTube (10-15%) + Others (5-10%) |
Putting It All Together: A 90-Day CAC Reduction Plan
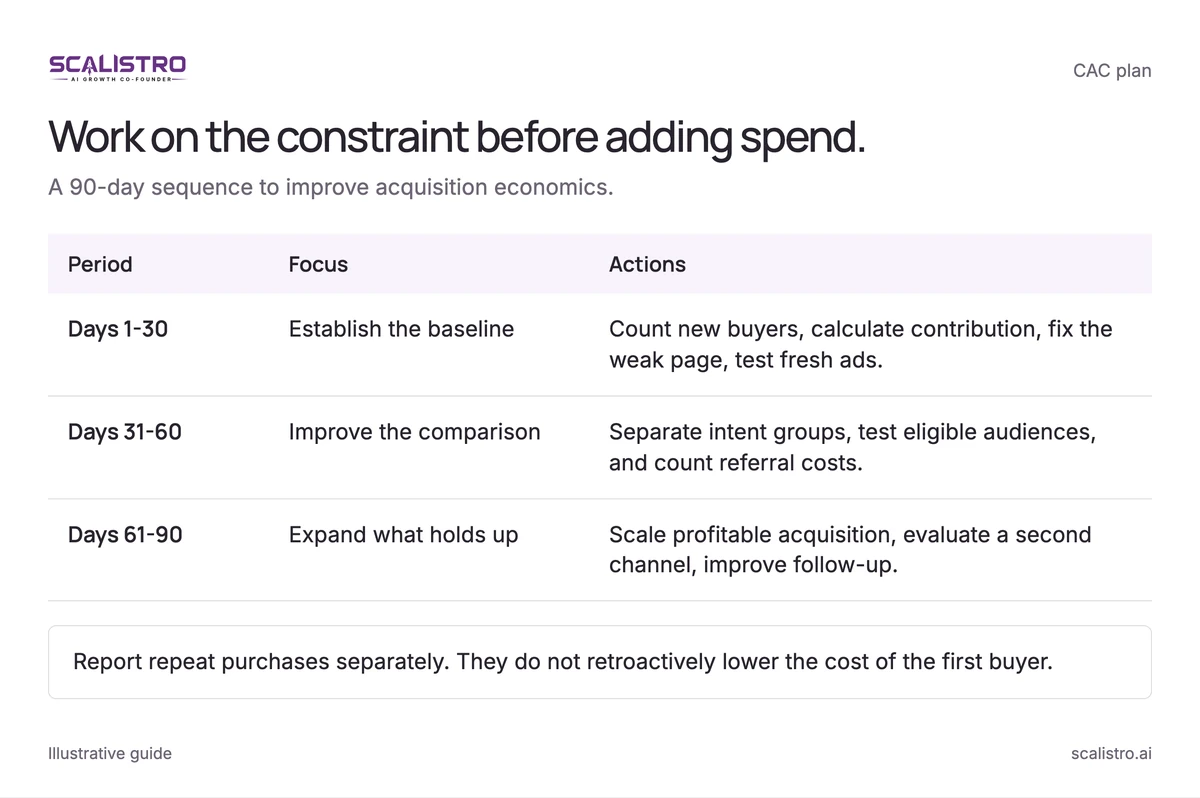
Make changes in three stages. Your result will depend on the starting problem.
Swipe to explore. Tap to open full size.
Image details: Work on the constraint before adding spend.
| Period | Focus | Actions |
|---|---|---|
| Days 1-30 | Establish the baseline | Count new buyers, calculate contribution, fix the weak page, test fresh ads. |
| Days 31-60 | Improve the comparison | Separate intent groups, test eligible audiences, and count referral costs. |
| Days 61-90 | Expand what holds up | Scale profitable acquisition, evaluate a second channel, improve follow-up. |
Report repeat purchases separately. They do not retroactively lower the cost of the first buyer.
Days 1-30: Check how many new buyers each channel brings in. Work out profit after order costs, fix the weakest product page, and test a few new ads.
Days 31-60: Show different ads to cart visitors and casual visitors. Test a lookalike group based on your best buyers if the list is large enough. Try a referral offer and count both rewards.
Days 61-90: Spend more on the ads that bring in profitable new buyers. Consider a second channel. Add useful emails after purchase to help buyers return.
At the end, compare the cost of a new buyer with Day 1. Report repeat purchases separately so they do not make acquisition look cheaper than it was.
Start with the D2C landing page guide if paid traffic reaches the page but few visitors buy.