Meta Ads for D2C Brands: Campaign and Creative Guide
Build Meta ads around clear conversion tracking, audience signals, product economics, and a repeatable creative testing process.
On this page
Meta remains a major D2C acquisition channel across Facebook, Instagram, Messenger, and Audience Network. For many D2C brands it is the largest share of paid acquisition budget.
Accounts now need a steadier supply of new creative than earlier Meta playbooks assumed. This guide explains how to structure campaigns, choose audiences, test creative, pace budgets, and measure business results in 2026.
Meta Ads in 2026: What Has Changed
Meta gives delivery systems more room to find buyers, while advertisers still own the product message, budget, and economics.
The Algorithm Is Smarter - Let It Work
Meta's own tests have found lower purchase costs for Advantage+ shopping campaigns than for advertisers' existing setups (Meta, 2022). Use that capability by consolidating fragmented audiences and giving the system distinct, accurate creative options to test.
Twenty-five variants provide more test opportunities than five only when spend and review capacity are sufficient. Prioritize concepts that answer different buyer questions.
CPM Trends and What They Mean for You
CPM, CTR, and CPC differ by category and season. Use these 2026 category figures as an initial comparison for your own account:
| D2C Category | Median CPM | Median CTR | Median CPA |
|---|---|---|---|
| Beauty | $18.80 | 2.46% | $39.31 |
| Health & Wellness | $21.80 | 3.02% | $40.53 |
| Apparel & Accessories | $13.25 | 2.44% | $36.98 |
| Food & Beverage | $15.32 | 1.98% | $38.57 |
| Home & Garden | $14.67 | 2.38% | $47.93 |
Source: Meta Ads medians for August 2025 to July 2026 from Triple Whale's benchmarks by industry.
Median Meta CPM rose 13 percent year over year to $15.06 in Triple Whale's August 2025 to July 2026 data, while median CPA rose 3 percent to $38.99 (Triple Whale, 2026). Judge affordability from contribution margin and customer value, not CPM alone.
Campaign Structure: The 2026 Framework
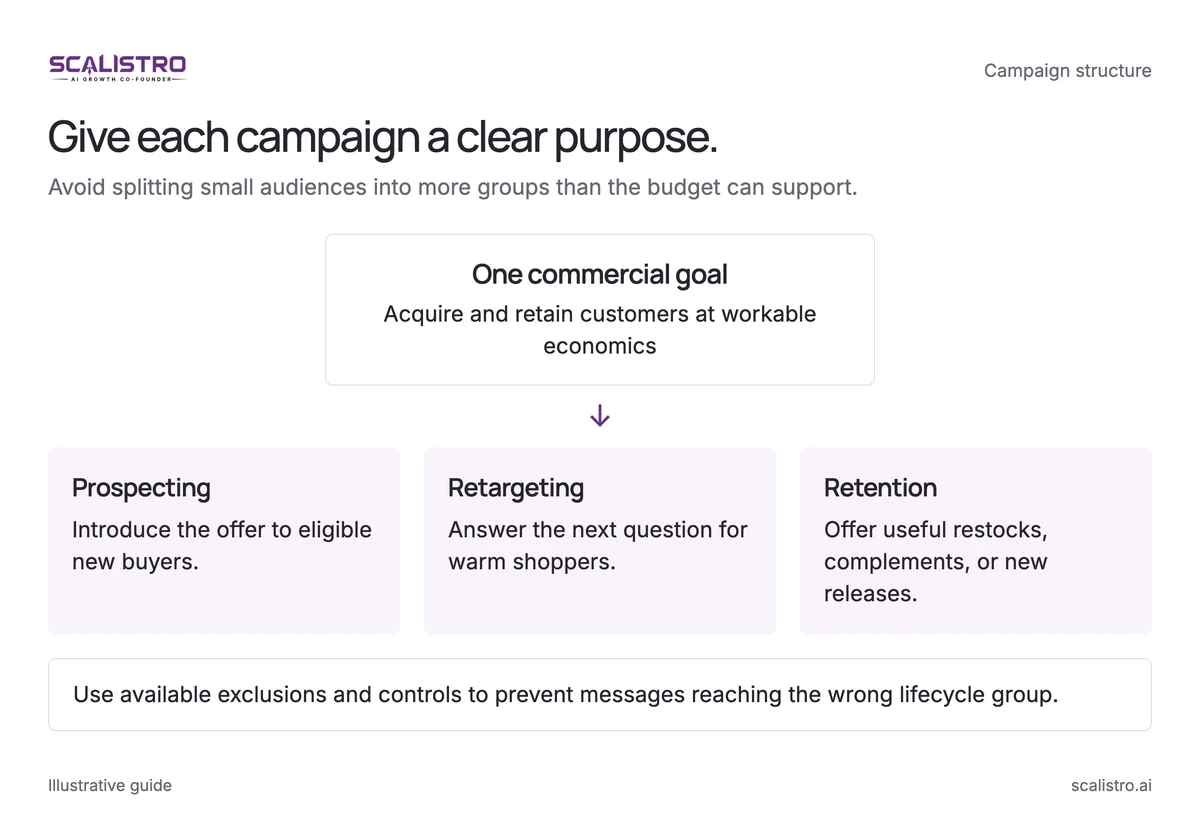
Use fewer campaigns with a clear purpose. Too many small ad sets split conversion data and make it harder to see which creative works. The three layers below cover new customers, warm shoppers, and existing buyers.
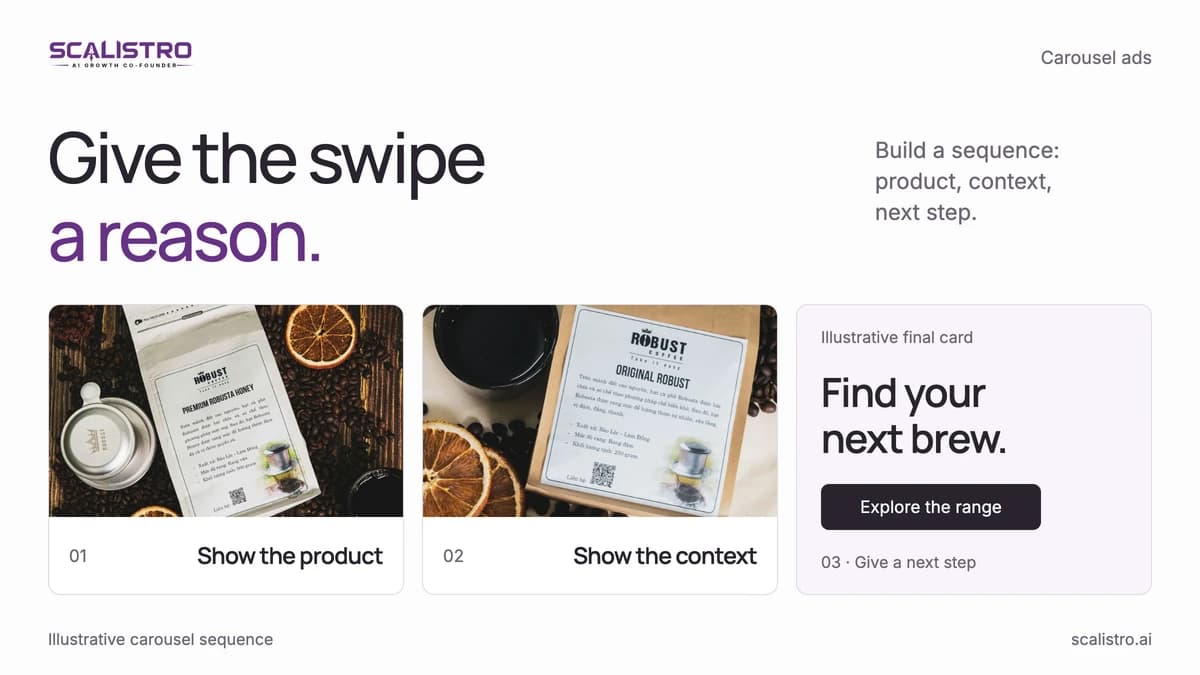
Swipe to explore. Tap to open full size.
Image details: Give each campaign a clear purpose.
Give each campaign a clear purpose. Avoid splitting small audiences into more groups than the budget can support. Prospecting - Introduce the offer to eligible new buyers.; Retargeting - Answer the next question for warm shoppers.; Retention - Offer useful restocks, complements, or new releases. Use available exclusions and controls to prevent messages reaching the wrong lifecycle group.
Layer 1: Prospecting (60-70% of Budget)
An Advantage+ sales campaign, formerly Advantage+ Shopping, can be a broad prospecting starting point. Set only the location and other genuine eligibility limits your product needs, then compare new-customer outcomes with a manual structure.
Settings to review:
- Existing customers: Use available customer exclusions or spend controls when the campaign setup supports them, then compare new-customer share with the 10 to 20 percent planning range.
- Creative volume: Load 15 to 25 creative assets into the campaign. Include a mix of static images, video ads, carousels, and UGC-style content.
- Budget: Minimum $100 per day for the algorithm to learn effectively. Brands spending less than $100 per day should use a single Advantage+ campaign with no more than 2 ad sets.
- Conversion event: Start with Purchase when the goal is sales. Fifty purchases a week can help delivery stabilize, but falling below that level alone does not mean an Add to Cart event will produce more buyers.
Layer 2: Retargeting (15-25% of Budget)
Use separate retargeting only when the warm audiences are large enough to support delivery. Exclude recent purchasers where the message no longer applies:
- Cart abandoners (0-7 days): Dynamic product ads showing the exact items left in cart plus a social proof element. Usually the highest reported ROAS in the account, though some of these buyers would have returned anyway.
- Product viewers (0-14 days): Lifestyle imagery of viewed products with benefit-focused copy and a mild incentive (free shipping, small discount). Expect lower reported ROAS than cart abandoners.
- Site visitors and social engagers (7-30 days): Brand story content, UGC, testimonials, and educational ads. Expect the lowest reported ROAS of the three retargeting groups.
Layer 3: Retention and Upsell (10-15% of Budget)
Use product history to offer restocks, complements, and new arrivals to existing buyers. Reported ROAS can look very high, but some orders would have happened through email or direct traffic. Compare incremental revenue before expanding this layer.
Creative Strategy: The Most Important Lever
Nielsen research cited by Meta found that creative drives 56 percent of a campaign's sales ROI (Meta, citing Nielsen). Test the product demonstration, benefit, and proof with the same care you give budgets and audience settings.
The 4 Creative Formats Every D2C Brand Needs
Use a mix that fits the product and available production capacity. Keep every claim and visual faithful to the item being sold.
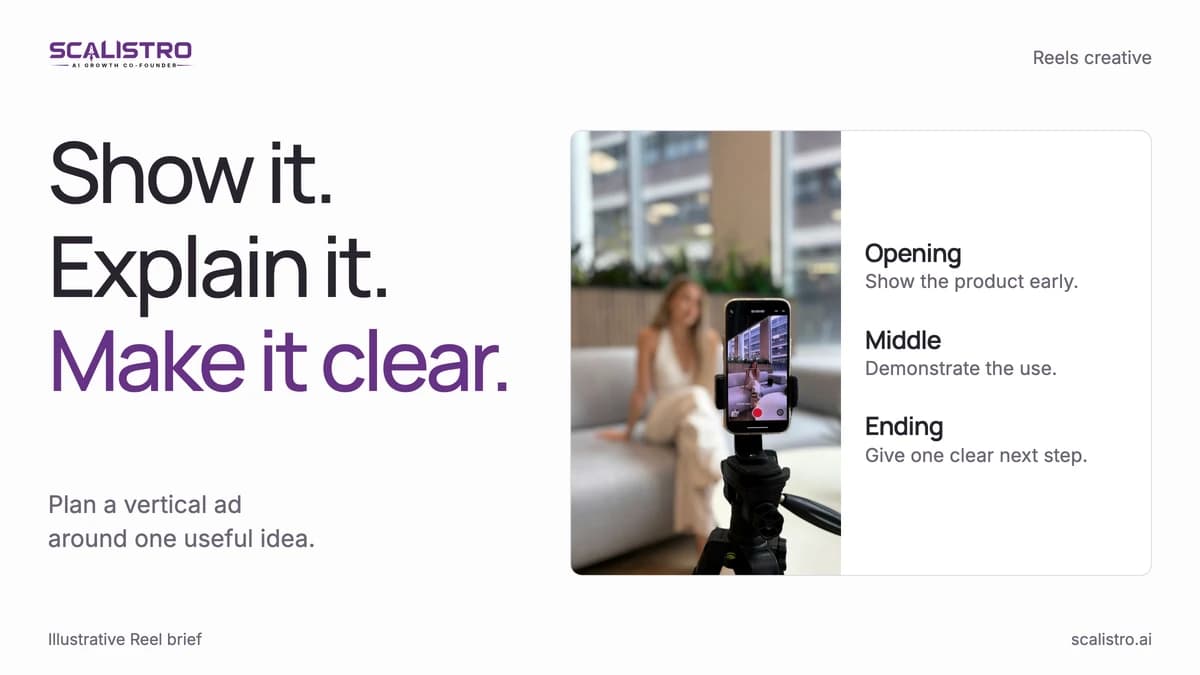
- UGC-style talking head videos (15-30 seconds): A real person (customer, founder, or UGC creator) speaking directly to camera about the product. They are a strong format to test for cold prospecting against polished studio ads. The key elements: an attention-grabbing hook in the first 2 seconds, a clear benefit statement, social proof (I have been using this for X weeks), and a direct CTA.
- Static product images with text overlay: Clean product shots with a bold headline communicating the primary benefit. These are the workhorses of Meta advertising - easy to produce in high volume, quick to test, and consistently solid performers. Target a click-through rate above 1.5 percent.
- Carousel ads: A sequence of problem, product, benefit, proof, and offer. Meta reports carousel link ads delivered 20 to 30 percent lower cost per click and 30 to 50 percent lower cost per conversion than single-image link ads (Meta); measure purchase cost in your own account before deciding which format wins.
- Before-and-after or transformation content: Showing results drives action. This format works exceptionally well for beauty, health, fitness, and home improvement D2C brands. Note that Meta has strict policies about before-and-after imagery - always review their advertising standards to ensure compliance.
Creative Testing Framework
For accounts spending $20,000 to $200,000 monthly, reserve a test budget that can give each concept enough conversion data to evaluate:
- Generate hypotheses: Each week, identify 3 to 4 creative angles to test based on your performance data and competitive landscape. Examples: a new benefit angle, a different hook format, a new visual treatment.
- Produce variations: For each hypothesis, create 3 to 5 variations. Use AI tools to generate these quickly - a tool like Listro can produce creative variations from a single brief in minutes, not days.
- Launch in testing structure: Use $20 to $50 per variation per day for 3 to 5 days as a planning range. One thousand impressions and 10 to 15 conversions can provide an initial read, but statistical confidence depends on the baseline rate and the difference you need to detect.
- Evaluate using the right metrics: For video ads, evaluate hook rate (3-second view rate - target above 30 percent) and hold rate (through-play rate - target above 15 percent). For all ads, evaluate CTR (target above 1.2 percent), CPC (compare to category benchmark), and CPA.
- Graduate winners: Move ads that beat your CPA target by 10 percent or more into your main prospecting campaign. Scale budget by 20 percent per day maximum to avoid triggering a learning phase reset.
Audience Strategy: Broad vs. Targeted
Broad targeting is often a good starting point, but product eligibility, budget, and the quality of customer data still matter.
When to Use Broad Targeting
Clear creative can help Meta find likely buyers without many interest filters. At $200 a day or more, broad delivery gives the system more room to compare shoppers. Keep necessary geographic or product restrictions.
When Targeted Audiences Still Win
Test a more specific audience when these conditions make it plausible:
- Low-budget campaigns (under $100 per day): With limited budget, the algorithm has fewer learning opportunities. Constraining the audience to your most likely buyers gives the algorithm a head start. Use 2 to 3 percent lookalikes based on high-LTV customers.
- Niche products: If your product serves a very specific use case (e.g., rock climbing gear, vegan pet food), interest targeting helps the algorithm find the relevant audience faster.
- Launch campaigns: When you have no pixel data, start with interest-based targeting and 1 percent lookalikes from your email list. Transition to broad targeting once you have 100 or more conversions in the pixel.
Budget and Bidding: Getting the Numbers Right
Set budgets from target CPA and margin, then pace increases against actual results. No fixed daily increase guarantees stable delivery.
Minimum Budget Thresholds
About 50 optimization events per week is a common learning benchmark. At a $30 CPA, that corresponds to $1,500 weekly spend, or about $214 a day. Smaller accounts can still run purchase campaigns, but consolidating into one $100 daily ad set may give delivery a clearer signal than four $25 ad sets.
Scaling Strategy
Use 20 percent budget increases as a cautious starting rule, then watch purchase cost and delivery for 24 to 72 hours. Larger edits can destabilize performance, but there is no universal reset threshold.
- Increase budget by 20 percent on Monday.
- Monitor performance for 48 hours.
- If CPA holds within 15 percent of pre-scale levels, increase another 20 percent.
- If CPA spikes more than 25 percent, hold for 3 to 5 days before trying again or test new creative to refresh the campaign.
Gradual increases usually disturb delivery less than sudden doubling, which can push CPA up for a week or more. Use your account's own response to set the pace.
Measurement and Optimization
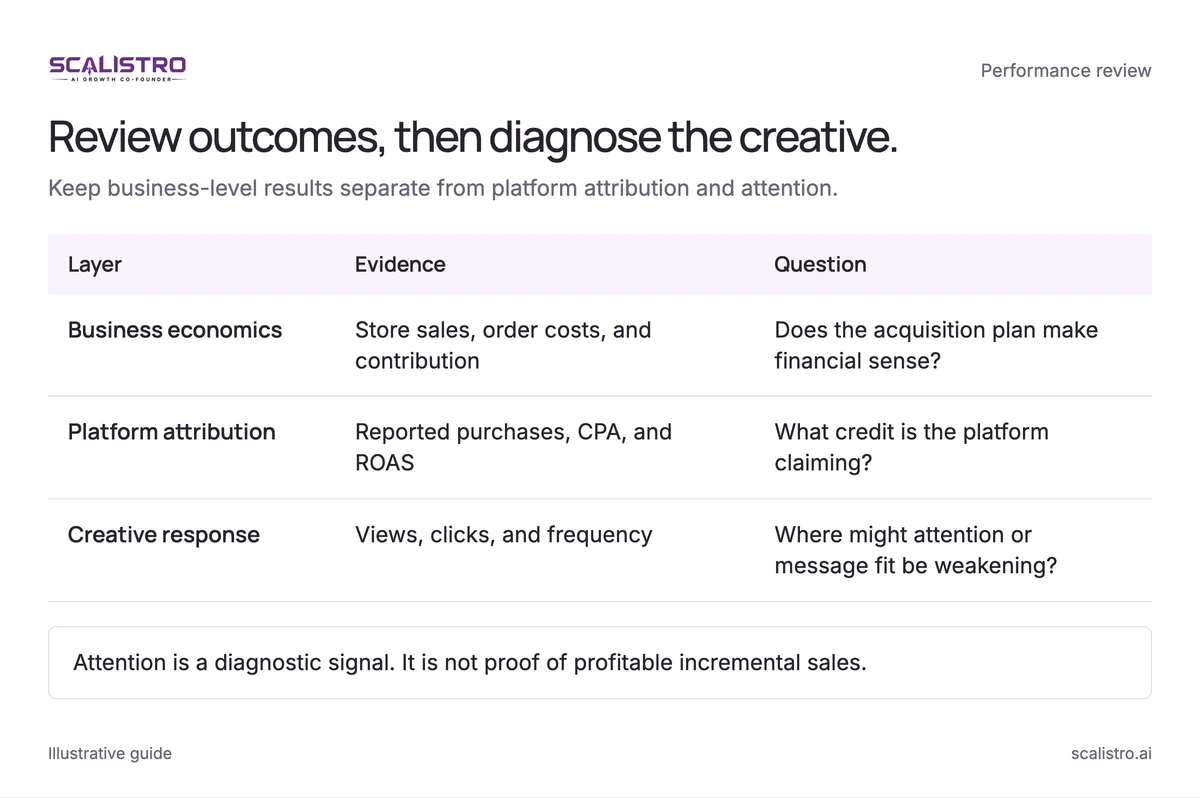
Review business-level efficiency alongside Meta's attribution, then use creative and delivery metrics to diagnose changes:
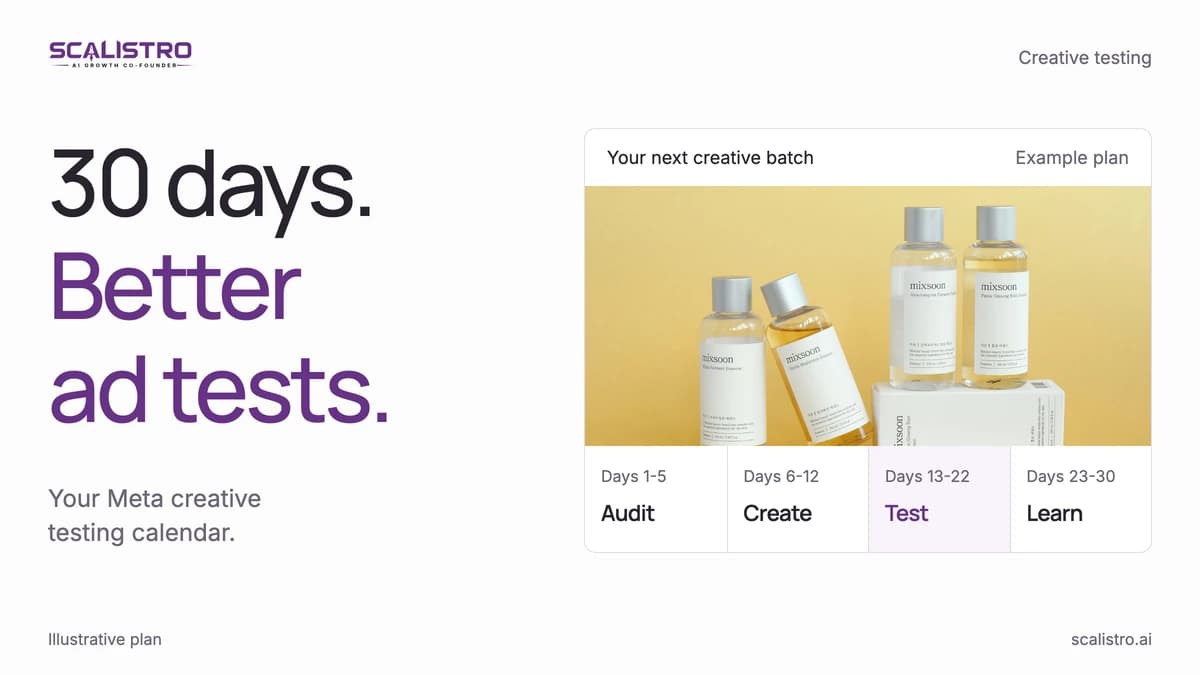
Swipe to explore. Tap to open full size.
Image details: Review outcomes, then diagnose the creative.
| Layer | Evidence | Question |
|---|---|---|
| Business economics | Store sales, order costs, and contribution | Does the acquisition plan make financial sense? |
| Platform attribution | Reported purchases, CPA, and ROAS | What credit is the platform claiming? |
| Creative response | Views, clicks, and frequency | Where might attention or message fit be weakening? |
Attention is a diagnostic signal. It is not proof of profitable incremental sales.
- Marketing efficiency ratio (MER): Total revenue divided by total ad spend across channels. A 3x target is a starting benchmark; contribution margin determines the profitable threshold for your brand.
- Meta-reported CPA: The cost per purchase reported by Meta Ads Manager. Compare this to your blended CPA to understand how much credit Meta is claiming versus what it is actually driving. A 20 to 30 percent gap is normal.
- Hook rate (video ads): Percentage of people who watch at least 3 seconds. Below 25 percent means your hook is failing - the content never even gets a chance. Above 35 percent means your hook is strong.
- CTR (all ads): Click-through rate. Triple Whale's median Meta CTR across ecommerce accounts was 2.39 percent for August 2025 to July 2026 (Triple Whale, 2026). A prospecting CTR well below your account's usual level points to a creative or messaging problem.
- Frequency: How many times the average person in your audience has seen your ad. Prospecting frequency above 3.0 signals fatigue - introduce new creative. Retargeting frequency above 6.0 means you are annoying people.
Common Mistakes to Avoid
These are common Meta account mistakes to check first when results fall:
- Too many campaigns: Brands running 8 to 12 campaigns with $50 per day each would almost always perform better consolidating into 2 to 3 campaigns at $200 per day each. Consolidation gives the algorithm more data to work with.
- Editing active ads: Making changes to an ad that is performing well resets its learning. Duplicate the ad, make changes to the copy, and run both. Do not touch the original.
- Optimizing too frequently: Making daily bid and budget changes based on 24-hour data is reactive noise. Evaluate performance on 3 to 7-day windows minimum. Statistical significance requires volume.
- Ignoring creative fatigue: Running the same 3 to 5 ads for weeks without introducing new creative is the most common cause of rising CPAs. Set a weekly cadence for new creative launches.
- Over-relying on ROAS: At a 50 percent gross margin, a 2x ROAS campaign spending $5,000 makes $10,000 revenue and breaks even after ad spend, before other costs. A 5x ROAS campaign spending $500 makes $2,500 revenue and $750 after ad spend. Calculate contribution profit and total scale instead of assuming the larger revenue campaign earns more.
When a campaign has stable results, follow the Meta ads scaling guide before increasing budget.